
“VC Winter” sends a shiver down the spine of entrepreneurs and investors alike. It’s a chilling period in the ever-evolving world of startups, characterized by a downturn in funding, cautious investors, and a more challenging landscape for emerging businesses.
Just as the seasons change, so do the fortunes of startups, and the concept of a VC Winter encapsulates the challenging times when the entrepreneurial ecosystem experiences a drastic decline in VC funding.
The VC Winter is not confined to a single market; it’s a phenomenon observed across most regions. Whether you’re in Silicon Valley or Southeast Asia, the sentiment seems to be the same: Economic uncertainties, driven by factors like the COVID-19 pandemic, geopolitical tensions, and inflation concerns, have led to investors becoming more risk-averse. In such times, they tend to favour established companies over startups.
We have witnessed this at Velocity Ventures. Our investment team had originally identified several promising investment opportunities, but the target company failed to raise enough cash from other investors to fund their growth plans for the next 18 months – a prerequisite for our investments.. We could not therefore proceed with these investments despite the target companies having great founders, proven business models and excellent sales traction.
Some Key Observations
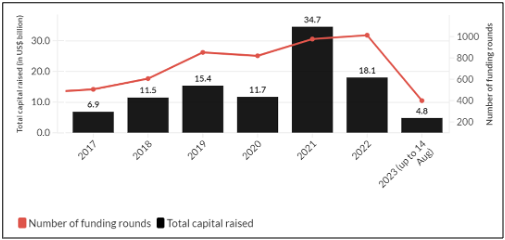
Here in Southeast Asia, fundraising by early-stage companies is the lowest in years.
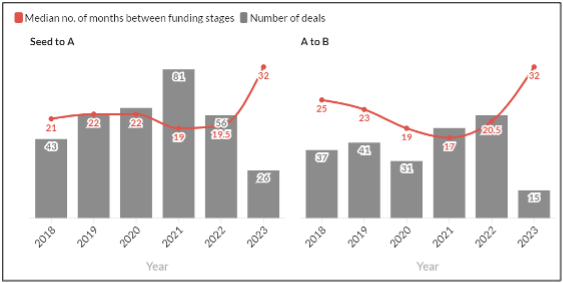
The time it takes for Early-Stage companies in Southeast Asia to raise funds is getting longer:
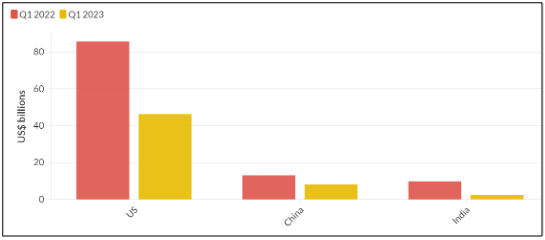
“Winter” is observed across most markets:
So should startups and investors be concerned that winter will be prolonged? Will 2023 eventually turn out to have been a bad time to invest in Venture Capital? To try and answer this question I turned to the data.
The holy grail in finance has always been to find a leading indicator (something that’s already happened) that reliably predicts future outcomes (something that’s going to happen). To explain how this works, let’s take the example of the following question: If the S&P 500 index has just gone up, is it a good time to buy the S&P 500 or to sell it?
Let’s take 1997 as an example year. The S&P 500 index had just risen by 30% over the previous 12 months, and after adding the dividend yield earned by that index during that year, the IRR on an investment in 1996 would have earned you an exceptional 32% return for the year. However, if you had invested into the index in 1997, and held for 6 years before exiting, you would have only made a measly 3% annual return on your investment.
We can do this analysis across multiple years:
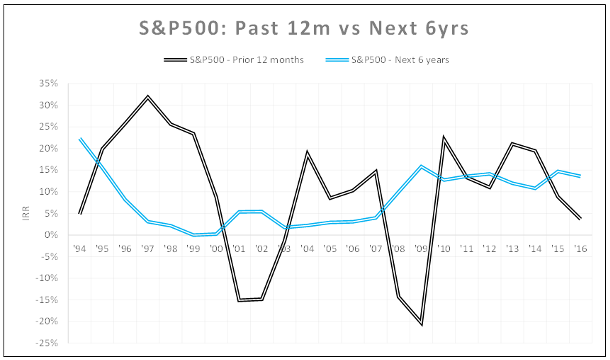
Visually, you can easily see there is no clear correlation between the index’s recent performance (black), and its future performance (blue). To be more precise we can calculate the “correlation” between these curves to determine if any predictive relationship exists.
Finding patterns to decide when is the best time to invest
A positive correlation represents that the 2 events move in parallel (example: daily rainfall and daily umbrella sales) while a negative correlation represents that the 2 events move in opposite directions (example: daily rainfall and daily sunscreen sales).
The above comparison yields a negative correlation of -0.17. This implies that the best time to invest in the S&P 500 index (if you intend to hold your position for 6 years) is immediately after it’s dropped in the previous 12 months. However, the correlation is not that strong (-1.0 represents a perfect negative correlation) at only -0.17, which is much closer to no correlation (0) than it is to a negative correlation (-1.0). A more reasonable conclusion would be that recent performance is not a strong indicator of future performance, but buying after a dip is probably a slightly better time to enter.
Analysing VC Performance
I used the same methodology to analyse VC performance. Typically, data on past performance is hard to collect as the results are often not made public, but we have two excellent sources in Preqin (a data and analytics firm for alternative investments) and Cambridge Associates (portfolio management and advisory). Both companies have conducted surveys on the results of thousands of VC funds and reported the results sorted by vintage year (the year in which the fund was launched).
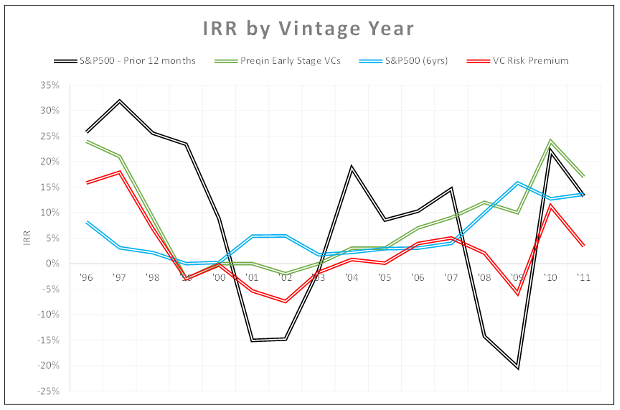
We can then compare the median IRR results for the sampled Prequin funds against the S&P 500 index over the same period (assuming 6 years, which is a typical time to hold an investment in a VC fund).
Typical VC Funds Outperform S&P 500 Index

Higher return, higher risks
We can see from this data that during a span of 6 years, VC funds outperformed the S&P 500 index (8.4% vs 5.6%), offering a premium of 2.7%, which translates to 48% higher returns from VC investments as compared to S&P 500. However, there is a risk-return tradeoff: The Standard Deviation on the IRR for VC investments was 9.1%, compared to a lower 4.9% for the S&P 500.
What the numbers reflect is that you can expect a VC investment to outperform an S&P 500 investment (made in the same year) only 60% of the time, but over time, will yield 48% higher returns on average.
Using Correlation for Predictive Analysis
So, when is the best time to ditch the S&P 500 and instead invest in VC? Back to correlation… The “Correlation” figures in the table above show the correlation between the IRR of an investment compared to the IRR delivered by the S&P 500 in the previous 12 months.
Once again, the results for this time period showed a negative correlation between recent S&P 500 results, and future S&P 500 results. A shrewd investor shouldn’t be buying the S&P 500 after it’s had a good run.
But there is a strong positive correlation between recent S&P 500 results and future VC results of +0.43. What this means is the best time to invest in VCs is shortly after the S&P 500 has risen!
Getting ahead
As a VC fund, our objective goes beyond just getting good returns. More important, our investments need to “beat the market” where the “market” is defined as the returns from the S&P 500 Index.
In this regard, if we look at the VC Risk Premium (ie. the amount by which the VCs beat the S&P 500) and correlate that to recent returns from the S&P 500, we get an even higher correlation of 0.76. This shows us that the best time to invest in VCs if you want to beat the market is after the S&P 500 has risen.
Using the same analysis, this time with the Cambridge Associates data set on VC Fund performance, produced extremely similar results.

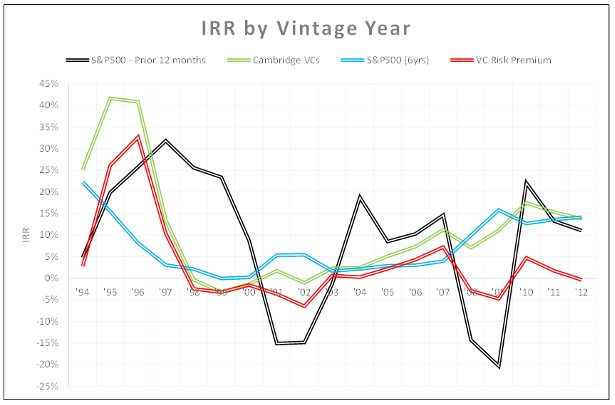
A snapshot of results showed:
- VC Funds gave 48% higher returns than the S&P 500 on average over the sample period.
- VC investments were riskier (only outperforming the S&P 500 60% of the time), but on average better.
- There was a negative correlation between recent S&P 500 returns and future S&P 500 returns.
- There was a positive correlation between recent S&P 500 returns and future VC returns, and VC Risk Premium.
Winter is Over!
Given that the S&P 500 index has risen from 3,839 at the start of 2023 up to 4,438 today, a lift of 16% over just 8 months, it would seem that the pessimism about VC investing (and the optimism about future gains in public markets) are not reflective of the real market performance.
Instead the data suggests that the VC Winter is over and that the VC industry can put their umbrellas in the closet. Of course, if you’re stepping out into the sunshine, get your sunscreen ready as you will need the extra protection. Expect some fresh capital deals to be announced as we head towards the Q4 2023.
