This publication is authored by the Investment Team at Velocity Ventures.
Led by Investment Director Bennett Lee, CFA, CAIA and supported by team members Edwin Lee, Alex Lai, Shivanand Kumanan.
Executive Summary:
The following is research done by Velocity Ventures on the appropriate equity discount rates that Southeast Asian Venture Capital investors could apply to their investment analysis. We captured the effects of illiquidity, probability of failure, and control premium on equity discount rates and analyse the risk premiums that minority and control investors should apply in addition to public equities expected returns. Based on our research done on more than 2500 Venture Capital deals done in Southeast Asia over a 10-year period from 2011 to 2021, we recommend appropriate equity discount rates and risk premiums as follows:
We adopted a model proposed by Luis E. Pereiro (2015)and applied data gathered from Southeast Asia Venture Capital deals from 2011 to 2021, which suggests that VC investors who hold a minority position should add a premium of 22.5%, while control investors should add a premium of 12.1% to public equities expected returns.
Introduction
Venture Capital (VC) in Southeast Asia is a multi-billion-dollar industry. However, the minimum required return on VC investments remains ambiguous and tends to vary for each investor. The reason for this is that the portfolios of Venture Capitalists usually contain control positions in earlier stage private ventures where its financial and operating performance may not be public information. In comparison to public equity portfolios that typically contain minority positions in seasoned and liquid companies, the VC asset class is riskier and different compared to public equities in three ways:
- Illiquidity: A large proportion of the companies that make up a VC portfolio do not make it to an Initial Public Offering (IPO), thus remain less marketable and liquid in comparison to public equities. Illiquidity decreases the value and increases the risk of a VC portfolio.
- Probability of failure: In any VC investment portfolio, a significant portion of the portfolio will undoubtedly go under. Such a probability of failure will also decrease the value and increase the risk of a VC portfolio.
- Control: Venture Capitalists often have a significant say over the decisions made by their target firms, even if they do not always hold majority positions in these firms. This capability to have control over the decision-making process of target companies increases the value and decreases the risk of a VC portfolio. In other words, control provides some compensation for the negative effects of illiquidity and the probability of failure to a VC portfolio.
Accounting for these factors, what then is the premium that a VC investor should add on top of the required return on public equities to receive adequate compensation for the additional risks? At Velocity Ventures, we aim to find the premiums specific to the Southeast Asian VC asset class and seek to understand the risk premiums specific to minority and control investors. A control investor is one who has significant influence over the decisions and actions of a company. Control investors might have a majority shareholding (51% or greater) of the company’s stock, but not always. An investor may have strong influence and/or board control within a company without majority shareholding and would still be considered a control investor. On the other hand, a minority investor is one who has little influence and power within a company.
In studying other classical finance models, the Capital Asset Pricing Model (CAPM) may not be best to provide us with the answers we are looking for. The CAPM fails to account for illiquidity of VC assets, the probability of failure of VC investments, and the control ability of Venture Capitalists. This yields less reliable estimates for the risk of a VC.
We instead adopted a model proposed by Luis E. Pereiro (2015)that considers illiquidity, probability of failure, and control capabilities of the VC asset class and formulated our aggregate risk premium estimates. Applying the data we gathered from Southeast Asia Venture Capital deals from 2011 to 2021, the model suggests that VC investors who hold a minority position should add a premium of 22.5%, while control investors should add a premium of 12.1% to public equities expected returns.
Determinants Of the Venture Capital Risk Premium
Let us consider three different investors in Southeast Asia: A, B, and C.
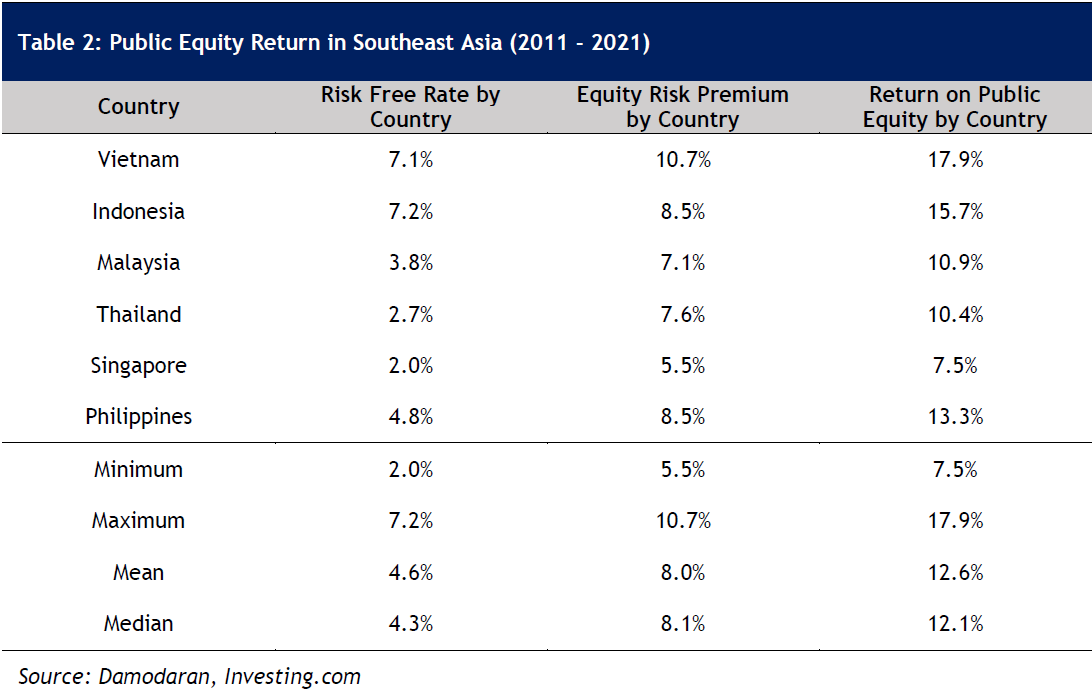
A is a diversified investor that invests entirely in Southeast Asian public equities. We looked at Equity Indices returns across Southeast Asia over a 10-year period and given the average risk-free rate of 4.6% and an average equity risk premium of 8.0%, A’s required return on public equities will be 12.6%.
B’s equity is entirely invested in a diversified portfolio of early stage Southeast Asian companies which consists of minority positions and lacking any board control or influence hence having no significant say over the decisions made by their target firms, which means that B is a minority VC investor.
C’s equity is entirely invested in a diversified portfolio of early stage Southeast Asian companies which consists of majority positions and having board control or influence hence having significant say over the decisions made by their target firms, which means that C is a control VC investor.
The main point we address is that investor B and C’s demand on risk premiums compared to A’s should adequately compensate for the risks of investing entirely in the Southeast Asian VC market.
Since illiquidity and the probability of failure effectively reduces the value of B’s and C’s portfolio, investor B and C must absorb an additional risk premium. For the purposes of this study, we will term this risk premium as the ‘Venture Capital Risk Premium’ (VCRP). VCRP is the minimum compensation that B and C should receive in addition to public equity returns as to be compensated for the risks of VC investments. C’s portfolio is equally as illiquid as B’s with the same probability of failure, but with the exception that C’s portfolio consists of control positions, meaning that C’s risk premium will be less than B’s due to the element of control. To accurately determine the VCRP, we must measure the effects of illiquidity, probability of failure, and control premium on the value of VC portfolios, and subsequently convert these effects into risk premiums.
Illiquidity Risk Premiums
Illiquid assets are defined as assets that cannot be easily sold or exchanged without a significant loss in value. Amihud and Mendelson (1986) tell us that rational investors would expect a greater return for investing in illiquid assets. Illiquidity premium can be obtained by comparing the difference in share price of public companies and private, but otherwise similar companies. One way to determine an accurate estimation for this premium would be to compare the share price of a company pre-IPO and immediately after IPO. The same company’s shares are traded at different prices, mainly because the company is now public and thus more liquid, or marketable.
Recently, Amihud, Hameed, Kang and Zhang (2019) have proposed that the average monthly illiquidity premium in the Asia-Pacific market is 1.05%. Velocity Ventures’ approach would be to use this figure of 1.05% as a proxy for the monthly illiquidity premium in the Southeast Asian market. Based on this, we obtain an illiquidity premium of 12.6% per year. Research by Ang and Sorensen (2012) and Damodaran (2006) suggests that the illiquidity premium in the U.S. market is approximately 4-6%. Given that the Southeast Asian market is generally less liquid than the highly liquid US market, a higher illiquidity premium of 12.6% in the Southeast Asian market seems reasonable.
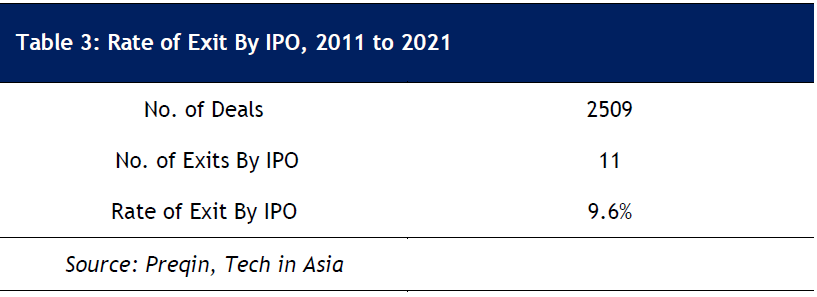
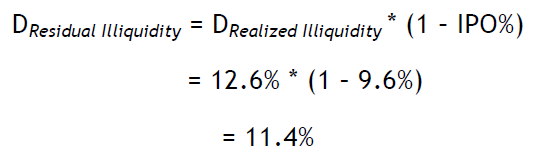
Considering that some companies in a VC portfolio will eventually go public, it would not be accurate to conclude that an entire VC portfolio is illiquid. Since we deem public companies to be more liquid, we must adjust the illiquidity discount. We have found that the percentage of IPOs in a Southeast Asian VC portfolio during the period from 2011 to 2021, is approximately 9.6%. We thus adjust for this, and the new illiquidity discount is 11.4% based on the following equation:
Probability of Failure
To accurately determine the probability of failure for Venture Capital in the Southeast Asian market, we first defined what constitutes a failure. For the purposes of this study, Velocity shall define failure as the inability to either reach Series E financing or achieve an exit via an IPO or Merger & Acquisition before that. We are defining failure such that if an early-stage company manages to reach Series E financing, its chance of an exit is significant. For conversative calculations, we shall deem the expected return from a failure (I.e., Early-stage companies that have not reached Series E financing) to be zero, which often is not the case with partial losses to the investor.
The follow-on financing data is gathered from Preqin (Table 4) over a period of 10 years, from 2011-2021, for the Southeast Asian market on more than 2500 Venture Capital deals. To determine the estimated rate of failure at each financing round, we calculated the difference between the number of deals from one stage to the next.
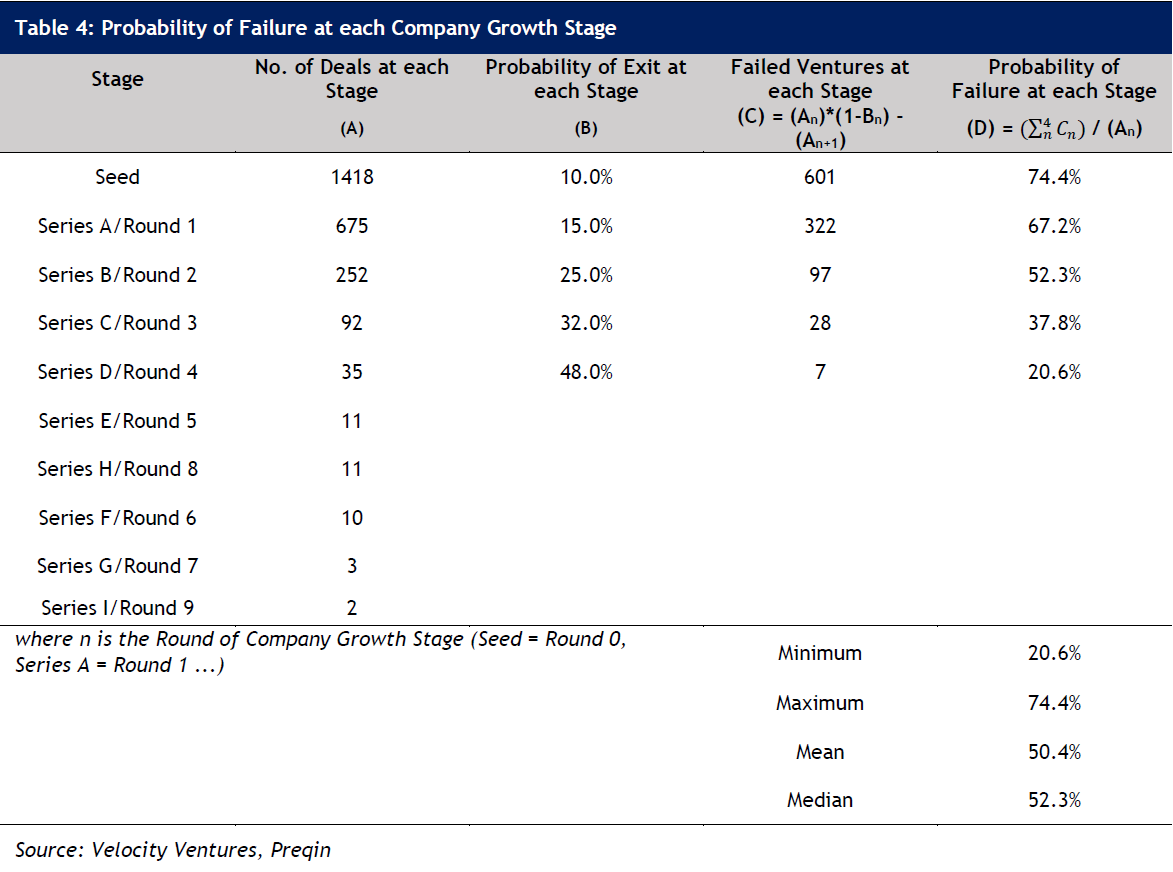
The mean realized probability of failure rates of 50.4% in Table 4 is a central value and therefore, useful only to VCs that plan invests in middle-stage companies. Other VCs may prefer to invest in riskier early-stage companies—in the seed capital and start-up phases where probability of failure is higher and others, in less risky, better-established companies, that are already transitioning towards a private sale or an IPO. To produce data relevant to all types of VCs, we compute in Table 4 the probability of failure per investment stage: failure rates go from 74.4%, for very early-stage ventures, down to 20.6%, for exit-stage ventures.
To estimate average failure-related discount on equity, or DFailure, it can be expressed as:

Where EFailure, or the value of equity adjusted for the probability of failure, can be obtained by deriving the weighted average of equity values for the survival and the failure scenarios:

Where P is the probability of failure rate and EquityFailure is zero as we deemed the expected return from a failure (I.e., Early-stage companies that have not reached Series E financing) to be zero. If failed ventures have zero value, and after some manipulation, it follows that:

And therefore, average failure-related discount on equity will be equal to its probability, namely, 50.4%.
Control Premium
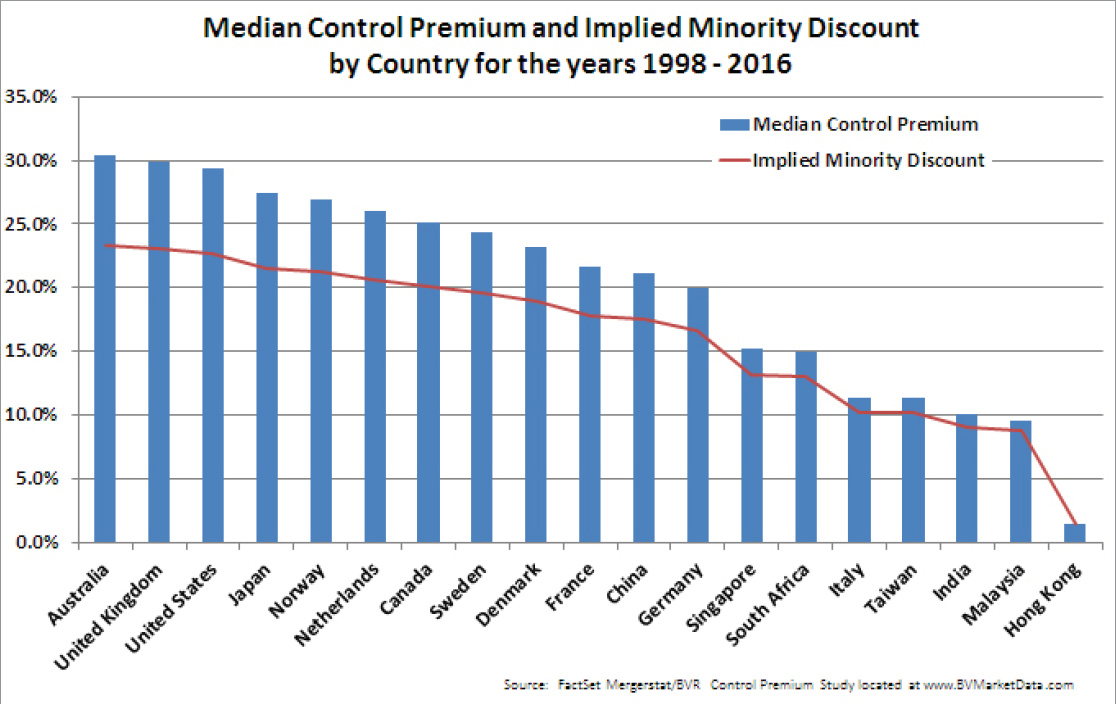
Using data from BV Resources and FactSet Mergerstat (2016), we obtained a median control premium of 15.2% for Singapore companies and 9.4% for Malaysia companies for the years from 1998 to 2016. We acknowledge the limitations of such a data set but also observed from other data points that distribution curves are generally symmetrical and lack skew and kurtosis. Hence, we decided to take an average of these control premiums, obtaining a value of 12.3%, and used this as a proxy for the control premium in Southeast Asia.
Estimating Aggregate Discount Rates
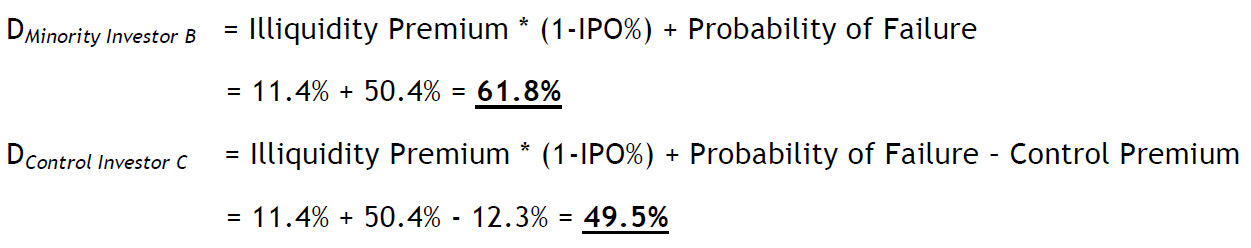
Based on the above, we can calculate an aggregate average discount rate for each investor type in the Southeast Asian VC market.
Estimating Discount Rates by Company Growth Stage Breakdown
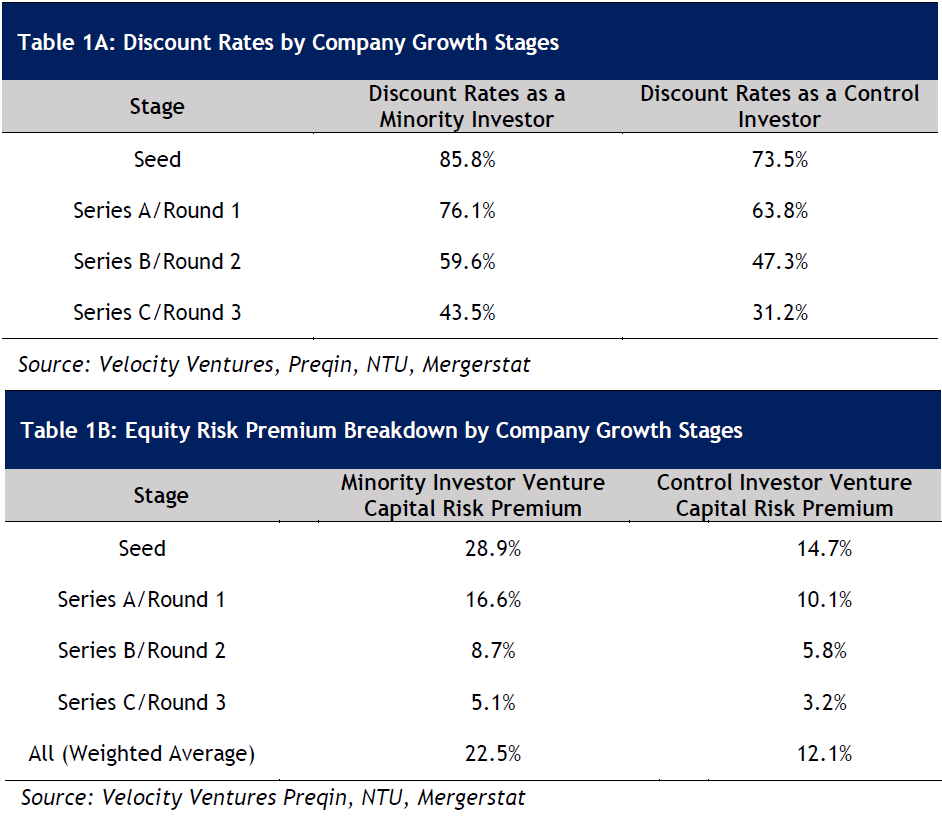
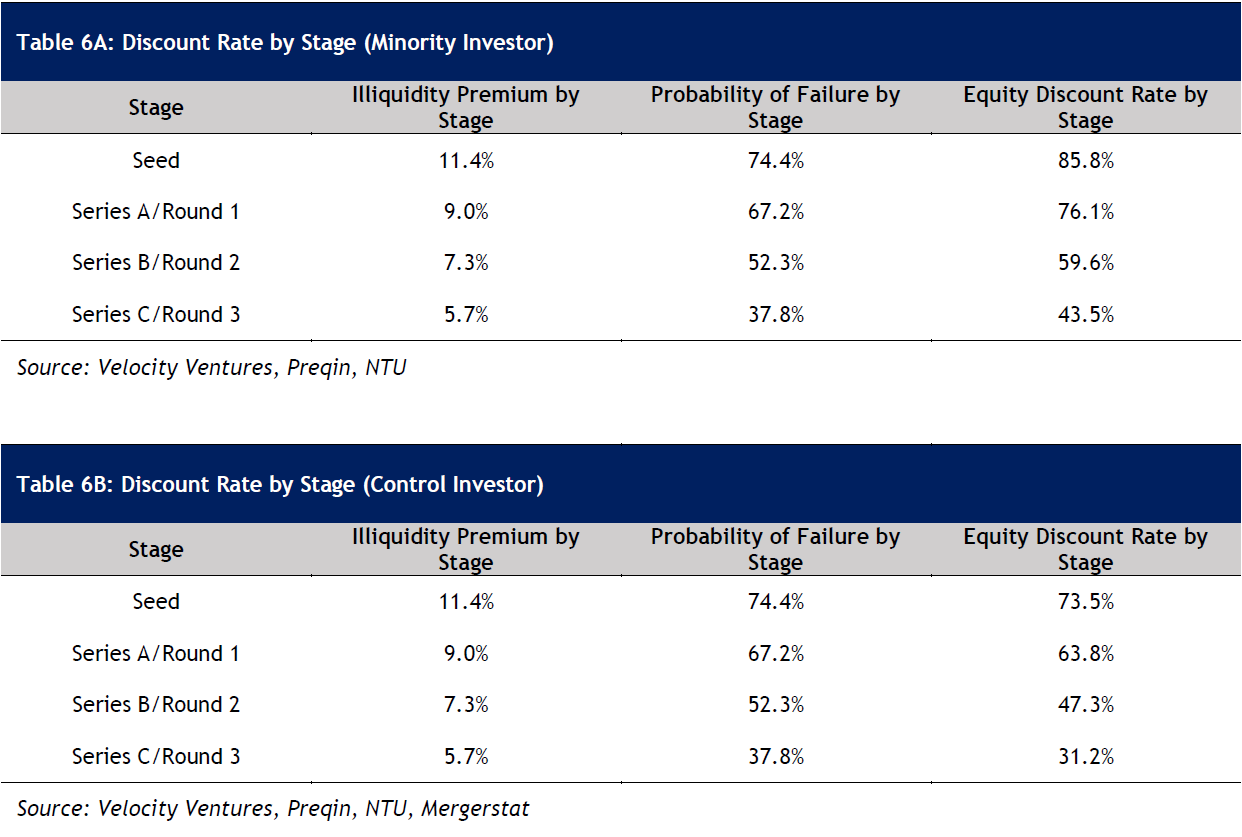
We then estimated the appropriate discount rates for different VC investors by varying illiquidity premiums. As a company grows, it becomes increasingly liquid and thus the illiquidity premium should decrease. Given our experience and market data, we understand that the average time taken for a Southeast Asia early-stage company to IPO is 7 years. We have illiquidity premiums listed below.
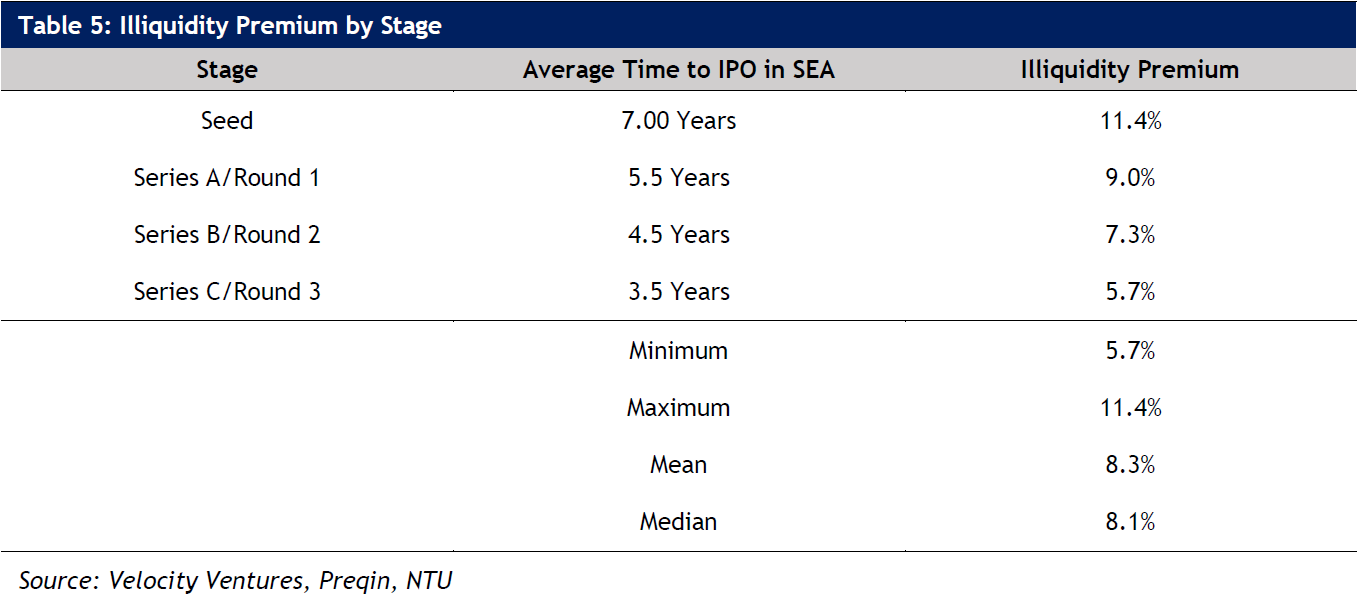
Aggregating the illiquidity premium and the probability of failure, we can obtain estimates of the appropriate discount rate by various company stages, from Seed to Series C, for minority and control investors in the Southeast Asian VC market. This can be seen in Table 6 below.
Obtaining Risk Premiums From Discount Rates
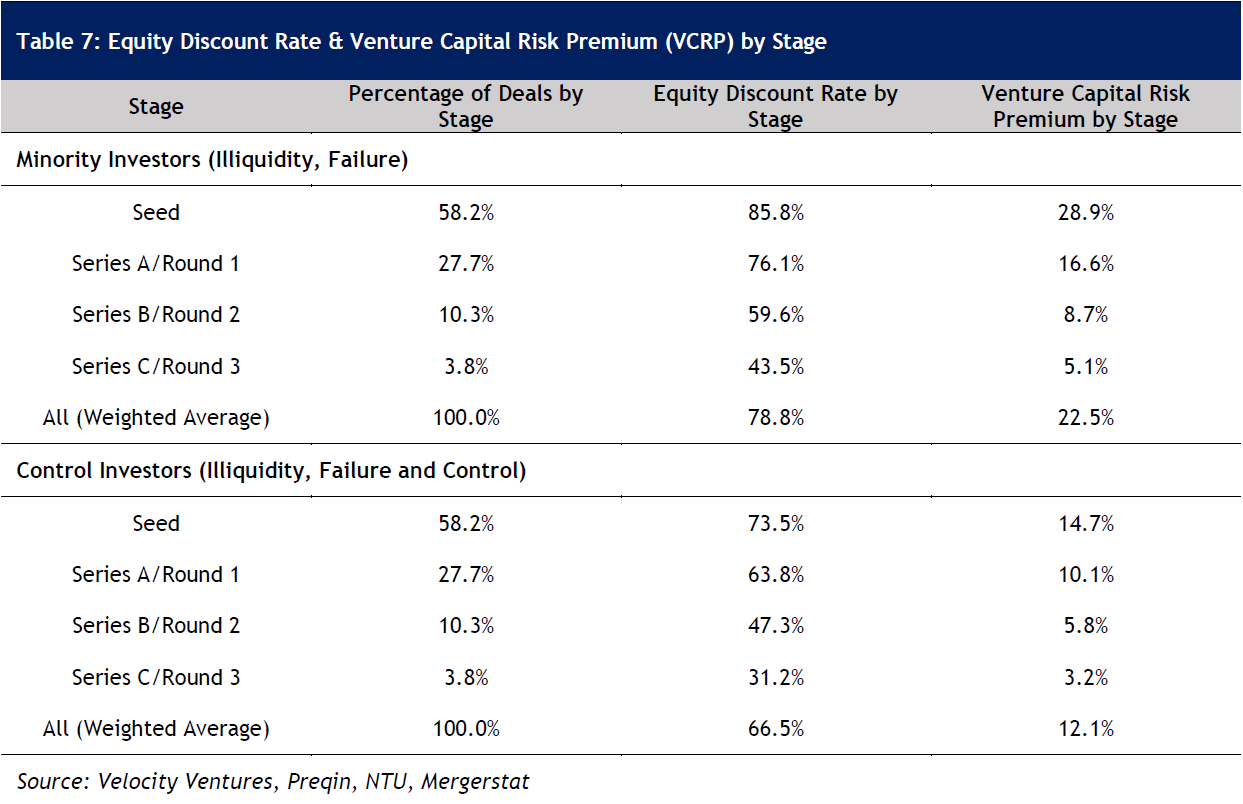
Through the estimates that we derived for the discount rates for minority investor B and control investor C, we make use of the following equation to obtain the Venture Capital Risk Premium (VCRP):

where K is a coefficient that depends on the growth rate in perpetuity of a VC portfolio’s cash flow, and D would be the aggregate equity discount rate. Exhibit A in the Appendix explains the empirical relation between risk premiums and equity discount rates, which was approximated based on the VCRP equation. As explained in Exhibit A, risk premium is denoted by (CE1 – CE0) which is the difference in opportunity cost after applying equity discount rate. Drawing parallel to the equation, (1/(1-D)) is the discount/premium factor applied to derive CE1 and (1-D) derives CE0. The difference multiplied with the perpetuity growth of an average VC portfolio, K coefficient, would then be the Venture Capital Risk Premium required for a VC portfolio. The value of 4.2% for the K coefficient is based on US industry data and is taken from Pereiro (2015). Velocity will use this growth rate of 4.2% (Exhibit B) as we assume that cashflow growth rates of Southeast Asia VC portfolio companies will mean revert towards more established markets like the U.S. over the long term.
We thus obtain a weighted-average risk premium of 22.5% for minority investor B and 12.1% for control investor C respectively.
Evaluating the Venture Capital Performance
We have used estimated illiquidity risk premiums, probability of failure, and control premiums to calculate VCRP, add them to public equity’s return, and this allows investors to compare the resulting figure against the historical returns generated for their VC investments. Given also that the return on public equities in the Southeast Asian market is 12.6%, a minority investor who invests in Venture Capital in the Southeast Asian market will require a return of 35.1%, while a control investor who invests in Venture Capital in Southeast Asia should require a return of 24.7%.
For VC analysts that use arbitrarily defined internal rates of returns (IRRs) to discount cash flows, they may instead start discounting at a return that contains the VCRP, truly capturing the effects of a venture’s illiquidity and probability of failure. Relying on VCRP benchmarks will likely help minority and control investors to price targets appropriately.
Appendix
Exhibit A: The Require Venture Capital Premium Model
Equity discounts are adjustments that apply directly to a venture’s equity value and are not risk premiums. To obtain premiums, we must express the value of a private equity investment as a function of its opportunity cost of capital.
An equity discount rate, D, can be expressed as follows:
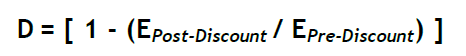
where E is the equity value of the venture. We can expand this formula using the discounted cash flow model to obtain this following equation:
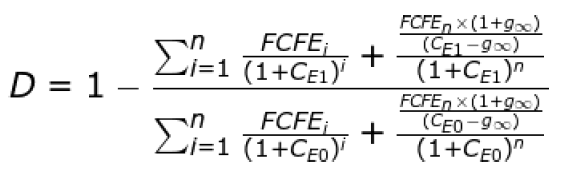
where CE0 and CE1 are the opportunity costs before and after applying the discount D on equity respectively, given that CE1 > CE0 . FCFEi is the venture’s free cash flow to equity in period i, while g∞ is the growth rate in perpetuity of the cash flow. Risk premium (RP) is equal to CE1 – CE0 , meaning that this equation allows us to identify the relationship between equity discounts and risk premiums given three parameters. Firstly, the shape or structure of a venture’s cash flow over time; the cash flow of a venture typically S-shaped—VCs call it “J-curve” or “hockey-stick”’ pattern—a path along which cash flows start negative and take a dip before going up as seen in Panel A below. Second, the length of the VC’s holding horizon; the typical time span in VC is five years. Last is the value of g∞, the perpetual growth rate of the last cash flow in the holding period, which was 4.2% for the U.S. VC industry (Exhibit B).
The empirical relation between value and premium is shown in Panel B, to which a statistically significant equation was fitted. Referencing Pereiro’s (2015) publication, Panel B shows the empirical relation between discount and risk premium as obtained by simulation that uses the above FCFE Equation. The “OBS” curve plots the actual relation between observed risk premium, RP, and the discount on a venture’s equity, D. RP equals (CE1 – CE0), whereby CE0 (CE1) is the venture’s equity value before (after) applying discount D to equity. The “EST” curve depicts the estimated (predicted) relation between discount and risk premium using a strictly monotonic increasing function that is approximated well by the following homographic polynomial, in which the risk premium asymptotically approaches + ∞ when the discount approaches 100%: VCRP = 0.005064 . [((1/(1 – D)) – (1 – D)]. The regression is highly significant (Adjusted R2: 0.996; t-coefficient: 140.16; p-value: 0.000). The equation’s coefficient is invariant with respect to the cash flow, but dependent on its growth rate; see Exhibit B for details.
Panel A: Cash Flow Prototype of a VC Project
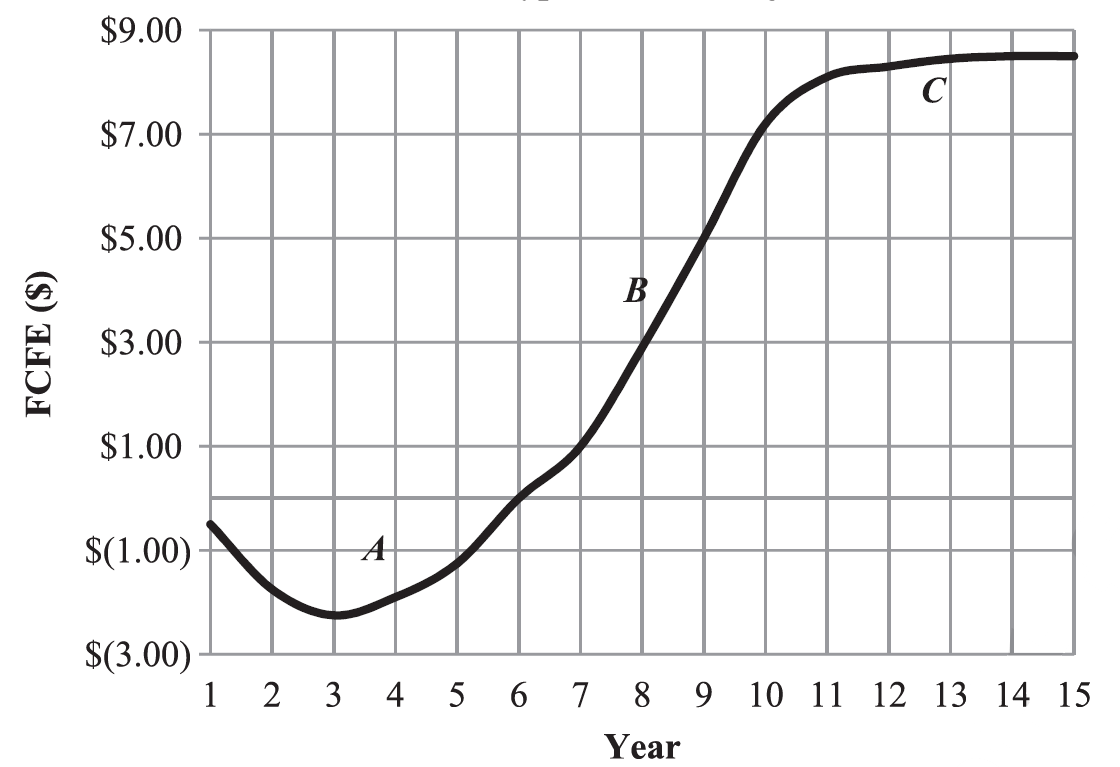
Source: Luis E. Pereiro (2015)
Panel B: The Relationship Between Discount Rates and Risk Premiums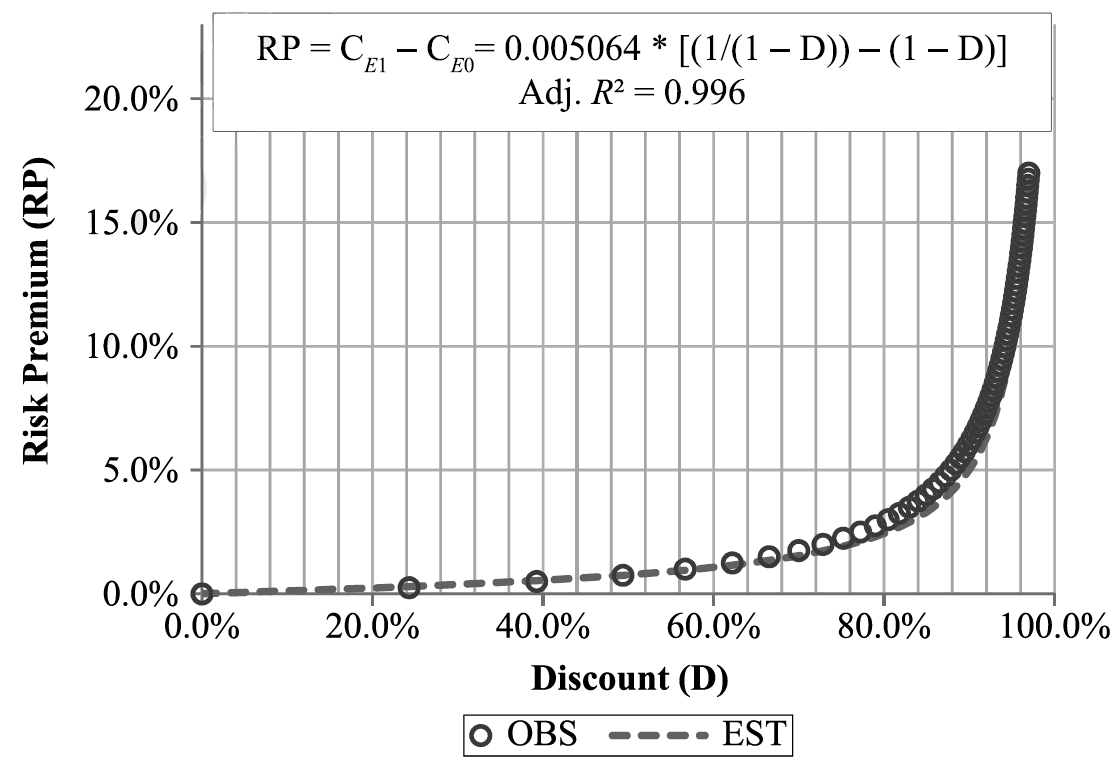
Source: Luis E. Pereiro (2015)
Exhibit B: The Perpetual Growth Rate of Cash Flow in a VC Porftolio
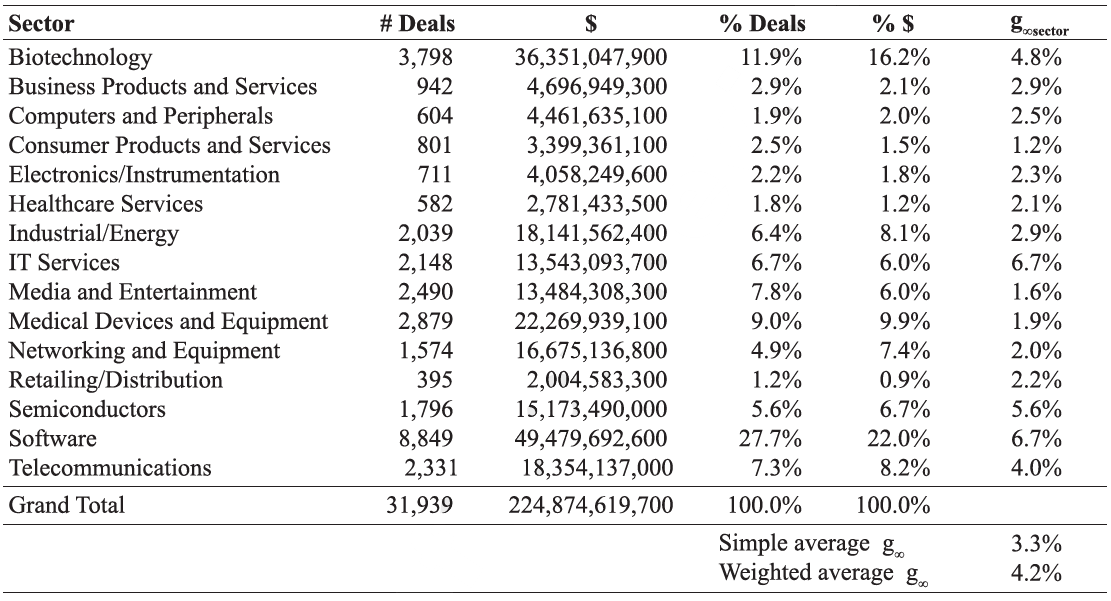
Referencing Pereiro’s (2015) publication, the growth rate in perpetuity of the cash flow of the average U.S. VC portfolio, g∞, can be computed as a weighted average of the dollar volume allocated to the sectors that compose the portfolio, and g∞ Sector, the perpetual growth rate of the sectors’ cash flows. g∞ Sector will depend on the growth potential of a sector’s aggregate demand: it is only natural to expect that, in the foreseeable future, the demand for products and services of younger industries (like software or biotechnology) will be higher than that for declining ones (e.g., traditional newspapers or tobacco). Second, g∞ Sector will be a function of the return on capital employed (ROCE) achieved in the sector. Mauboussin and Johnson [1997] have argued that firms with larger ROCE figures are those better able to shield their profits from the competition. A sector with a higher ROCE will likewise be able to sustain a positive cash flow growth for longer periods. Then the larger the expected revenue growth and ROCE of an industry, the larger its g∞ Sector will be. Over the longer term, the growth rate of the aggregate corporate cash flow of public companies closely matches that of the nominal gross domestic product (GDP) and contain two characteristics: they reflect the differentials of sustainable demand and profits across sectors and, at the same time, do not violate the empirical constraint that aggregate cash flows must grow at the economy’s rhythm. In Panel C, Pereiro finds that, at an assumed economy’s growth rate of 7%, the cash flow of the average U.S. VC portfolio turns out to grow at 4.2%.
Panel C: Sector Breakdown and Perpetual Growth Rate of the Cash Flow in the Average U.S. Venture Capital Portfolio
References
- Ang, A., and Sorensen, M. Risks, Returns, and Optimal Holdings of Private Equity: A Survey of
- Existing Approaches., 2012.
- Amihud, Y., and Mendelson, H. Asset pricing and the bid-ask spread. Journal of Financial Economics, 17 (2) (1986), pp. 223-249.
- Amihud, Y., Hameed, A., Kang, W., and Zhang, H. The illiquidity premium: International evidence. Journal of Financial Economics, 117 (2) (2015), pp. 350-368.
- Amihud, Y. & Hameed, A. & Kang, W. & Zhang, H. The Illiquidity Premium: Further Evidence from Global and Asia-Pacific Markets. NTU Management Review, 29 (2019), pp. 1-24.
- BV Resources, and FactSet Mergerstat. Global Control Premia. 2016.
- Chan, L.K., J. Karceski, and J. Lakonishok. “The Level and Persistence of Growth Rates.” Journal of Finance, 58 (2003), pp. 643-684
- Cento Ventures. Southeast Asia Tech Investment in 2019, (2019), pp. 8
- Cochrane, J.H. “The Risk and Return of Venture Capital.” Journal of Financial Economics, 75 (2005), pp. 3-52
- Damodaran, A. “Country Default Spreads and Risk Premiums.” Welcome to Pages at the Stern School of Business, New York University, 2021.
- Damodaran, A. “The Cost of Illiquidity.” Welcome to Pages at the Stern School of Business, New York University, 2006.
- Damodaran, A. Useful Data Sets. Risk Premiums for Other Markets, 1/11 – 1/20
- Das, S.R., M. Jagannathan, and A Sarin. “Private Equity Returns: An Empirical Examination of the Exit of VentureBacked Companies.” Journal of Investment Management, 1 (2003), pp. 1-26
- Driessen, J., T.-C. Lin, and L. Phalippou. “A New Method to Estimate Risk and Return of Non-Traded Assets from CashFlows: The Case of Private Equity Funds.” Journal of Financial and Quantitative Analysis, 47 (2012), pp. 511-535
- Fusion Media Limited. “Indonesia 10-Year Bond Historical Data.” Investing.com
- Fusion Media Limited. “Malaysia 10-Year Bond Historical Data.” Investing.com
- Fusion Media Limited. “Philippines 10-Year Bond Historical Data.” Investing.com
- Fusion Media Limited. “Singapore 10-Year Bond Historical Data.” Investing.com
- Fusion Media Limited. “Thailand 10-Year Bond Historical Data.” Investing.com
- Fusion Media Limited. “Vietnam 10-Year Bond Historical Data.” Investing.com
- Gompers, P.A., and J. Lerner. The Venture Capital Cycle. New York: Wiley, 1999
- Hall, R.E., and S.E. Woodward. “The Burden of the Nondiversifiable Risk of Entrepreneurship.” American Economic Review, 100 (2010), pp. 1163-1194
- Huntsman, B., and J.P. Hoban. “Investment in New Enterprise: Some Empirical Observations of Risk, Return, and Market Structure.” Financial Management, 9 (1980), pp. 44-51
- Korteweg, A., and M. Sorensen. “Risk and Return Characteristics of Venture Capital-Backed Entrepreneurial Companies.” Review of Financial Studies, 23 (2010), pp. 3738-3772
- KPMG International Cooperative. Venture Pulse Q1 2020, (2020), pp. 84-95
- Ljungkvist, A., and M. Richardson. “The Cash Flow, Return and Risk Characteristics of Private Equity.” Working Paper, New York University, 2003
- Mauboussin, M., and P. Johnson. “Competitive Advantage Period: The Neglected Value Driver.” Financial Management, 26 (1997), pp. 67-74
- Pereiro, L. “The Venture Capital Premium: A New Approach.” The Journal of Private Equity, 18(3) (2015), pp. 7-18
- Pratt, S.P. Business Valuation Discounts and Premiums. New York: Wiley, 2009
- Pratt, S.P., R.F. Reilly, and R.P. Schweihs. Valuing a Business: The Analysis and Appraisal of Closely Held Companies. New York: McGraw-Hill, 1996
- Ruhnka, J.C., and J.E. Young. “A Venture Capital Model of the Development Process for New Ventures.” Journal of Business Venturing, 2 (1987), pp. 167-184
- Sahlman, W.A. “The Structure and Governance of Venture Capital Organizations.” Journal of Financial Economics, 27 (1990), pp. 473-521
- Sharpe, W.F. “Capital Asset Prices: A Theory of Market Equilibrium Under Conditions of Risk.” Journal of Finance, 19 (1964), pp. 425-442
- Wang, X. “Size Effect, Book-to-Market Effect, and Survival.” Journal of Multinational Financial Management, 10 (2000), pp. 257-273